Clairity transforms continuous CO₂, VOC, PM1/PM2.5/PM10 data into intuitive visualizations,
ranked insights, and exportable IAQ reports.
This page shows exactly how raw sensor data becomes actionable intelligence for schools and small buildings.
Dashboard Highlights
What you see at a glance

Understand how each space breathes throughout the day.
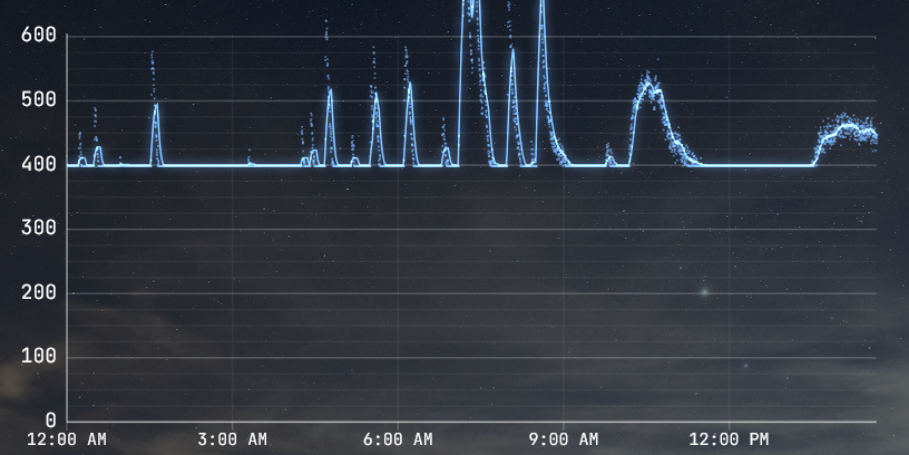
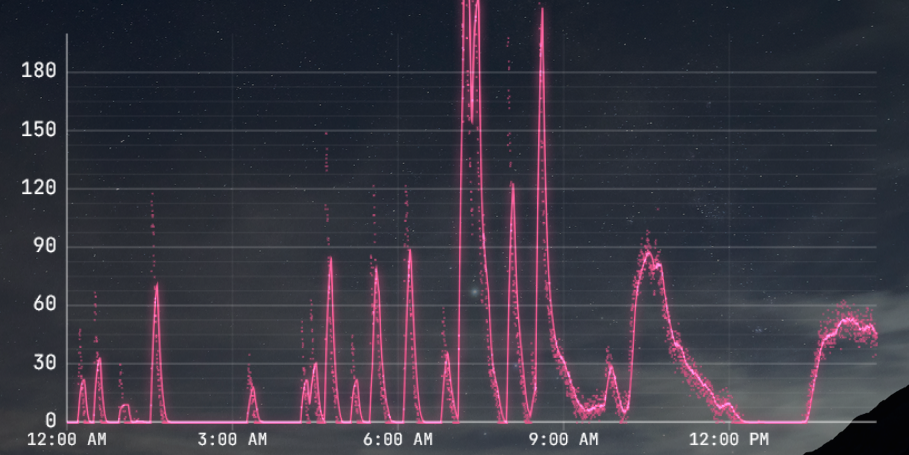
A high-level view to keep facilities teams ahead of issues.
Sample IAQ Summary (Weekly Overview)
Building Summary — Week of October 7–13
Clairity continuously monitored CO₂, VOCs, PM1/PM2.5/PM10 across 22 rooms.
This week’s data shows clear ventilation patterns, several rooms requiring attention, and improved
recovery rates in classrooms where adjustments were made.
Key Highlights
4 rooms exceeded recommended CO₂ thresholds during peak occupancy.
2 rooms showed abnormal VOC spikes, both immediately after after-hours cleaning.
Room 108 and Room 214 showed the strongest improvements after HVAC adjustments.
Most rooms recovered to baseline IAQ overnight, except two that remained partially elevated.
Rooms Requiring Attention
High CO₂ Levels
These rooms exceeded ASHRAE-recommended CO₂ during recurring time blocks:
Room Peak CO₂ Pattern Observed Likely Cause
204 1450 ppm Daily spike 10–11 AM Underventilation during class period
312 1380 ppm Afternoon spike Limited outdoor air intake
108 1320 ppm Short-cycle spikes Door closure + high occupancy
Teacher Lounge 1250 ppm Lunch periods Occupant density
Recommended Follow-Up:
Increase outdoor-air intake or schedule a short ventilation flush before high-occupancy periods.
VOC Alerts
Two rooms recorded significant VOC elevations:
Room 116: VOC spike at 6:42 PM, likely due to cleaning products.
Art Room: VOC fluctuations throughout the week associated with paint/adhesives.
Recommended Follow-Up:
Improve after-hours ventilation or adjust cleaning timing.
Comfort & Stability
Temperature: 86% of rooms remained within the comfort range (68–74°F).
Humidity: Stable across all rooms except the gym hallway (peaked at 63%).
Recommendation:
Monitor humidity trends in high-traffic corridors during peak hours.
Ventilation Recovery Rates
Clairity tracks how quickly rooms return to baseline air quality after occupancy:
Fast recovery: Rooms 101, 108, 214 — returned to baseline within 12 minutes
Moderate recovery: Rooms 202, 321 — returned within 20–30 minutes
Slow recovery: Room 204 — required 45+ minutes, indicating likely airflow imbalance
Overall IAQ Score (Building Average)
82 / 100
Strong temperature & humidity stability
CO₂ issues limited to a subset of rooms
Low VOC baseline except for isolated spikes
Summary
The building shows generally healthy indoor air, but a small group of rooms is consistently
underperforming.
Addressing the ventilation in Rooms 204, 312, and the Teacher Lounge would yield the largest improvement
in overall IAQ.
Book a demo and get a sample IAQ report.

Helping schools and small commercial buildings improve indoor air quality with real data — not assumptions.